Calibration
Instead of using a linear fit to calculate the battery percentage, the sketch uses the coulomb counting method by using the collection time interval and current passing to the battery.
 Exponential Trendline
The sketch uses an exponetial trendline for a voltage versus percentage to calculate the battyer percentage.
The formula for the exponential trendline is as follows:
The coefficients of the trendline can be found from the equation of the exponential trendline on the chart.
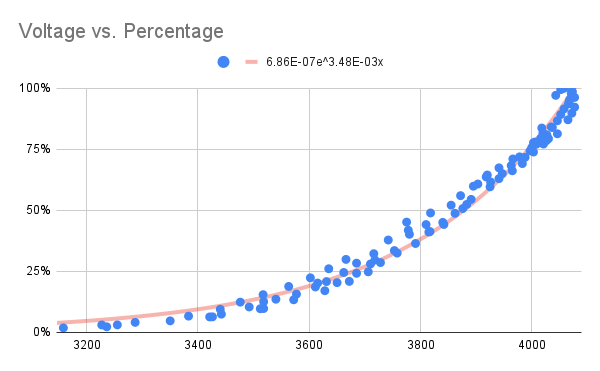
In this instance, the following coefficients are found:
These coefficients can then be entered into the config.h file as EXP_A and EXP_B.
Note
The coefficients supplied with the sketch were found using two 3000 mAh batteries.
The maximum and minimum voltages can be found by from this data as well and transcribed to the config.h file in the VOLTAGE_MAX and VOLTAGE_MIN parameters.
 Google Sheet
The scatter plot is created by performing the following steps:
- Collect data from when the batteries are fully depleted to fully charged. This can be done either using a solar panel or wall wart.
- Create a column that calculates the time in duration between readings in hours.
- Create a column that multiplies the current by the time duration to get the number of coulombs collected in that time interval.
- Create another column that sums the amount of coulombs collected up to that period in time.
- Create another column that calculates the percentage by dividing the previous column with the maximum number of coulombs collected.
- Create a scatter plot that with the voltage on the X-Axis and percentage on the Y-Axis.
- Add an exponential trendline with the equation in in the legend.
- Transcribe the coefficients of the trendline to the
config.hfile in theEXP_AandEXP_Bparameters.
Note
The data collection needs to start when the battery is fully depleted (cut off by the BMS) in order to accurately calibrate the system.
 Template
WIP (#57)
 Current Limitations
- The Google Sheet assumes that the current over the collection period is constant. Integration of the current versus time would be a better estimation of the amount of energy collected.
- The collection at the end of the charge can be a bit erratic and group around the same same voltage. This was clipped in my original data.
- The coefficients can only be found by the equation on the scatter plot chart. Have not figured out a way to calculate the coefficients in a Sheet cell (#58).
 References