v3
Monitor the charging battery level.
Sketch
The sketch can be found here.
Hypothesis
The Adafruit Feather Huzzah can be used to monitor the level of the charging li-ion battery as it is being charged by the solar panel.
Assumptions
- The
3.7Vli-ion is being used to capture the soloar energy and power the Feather. - The grounds of the TP4056 and Feather will not interfere with each other.
- The
VOLTAGE_MAXvariable is the actual maximum voltage that cuts off the charging of theTP4056.
Procedure
The li-ion battery is charged using a USB C wall plug until the battery is charged completely.
The USB C wall plug is then unplugged and the li-ion batteries are then plugged into a Chromebook to charge the Chromebook battery first with the Chromebook in sleep mode and then with the Chromebook being used while charging.
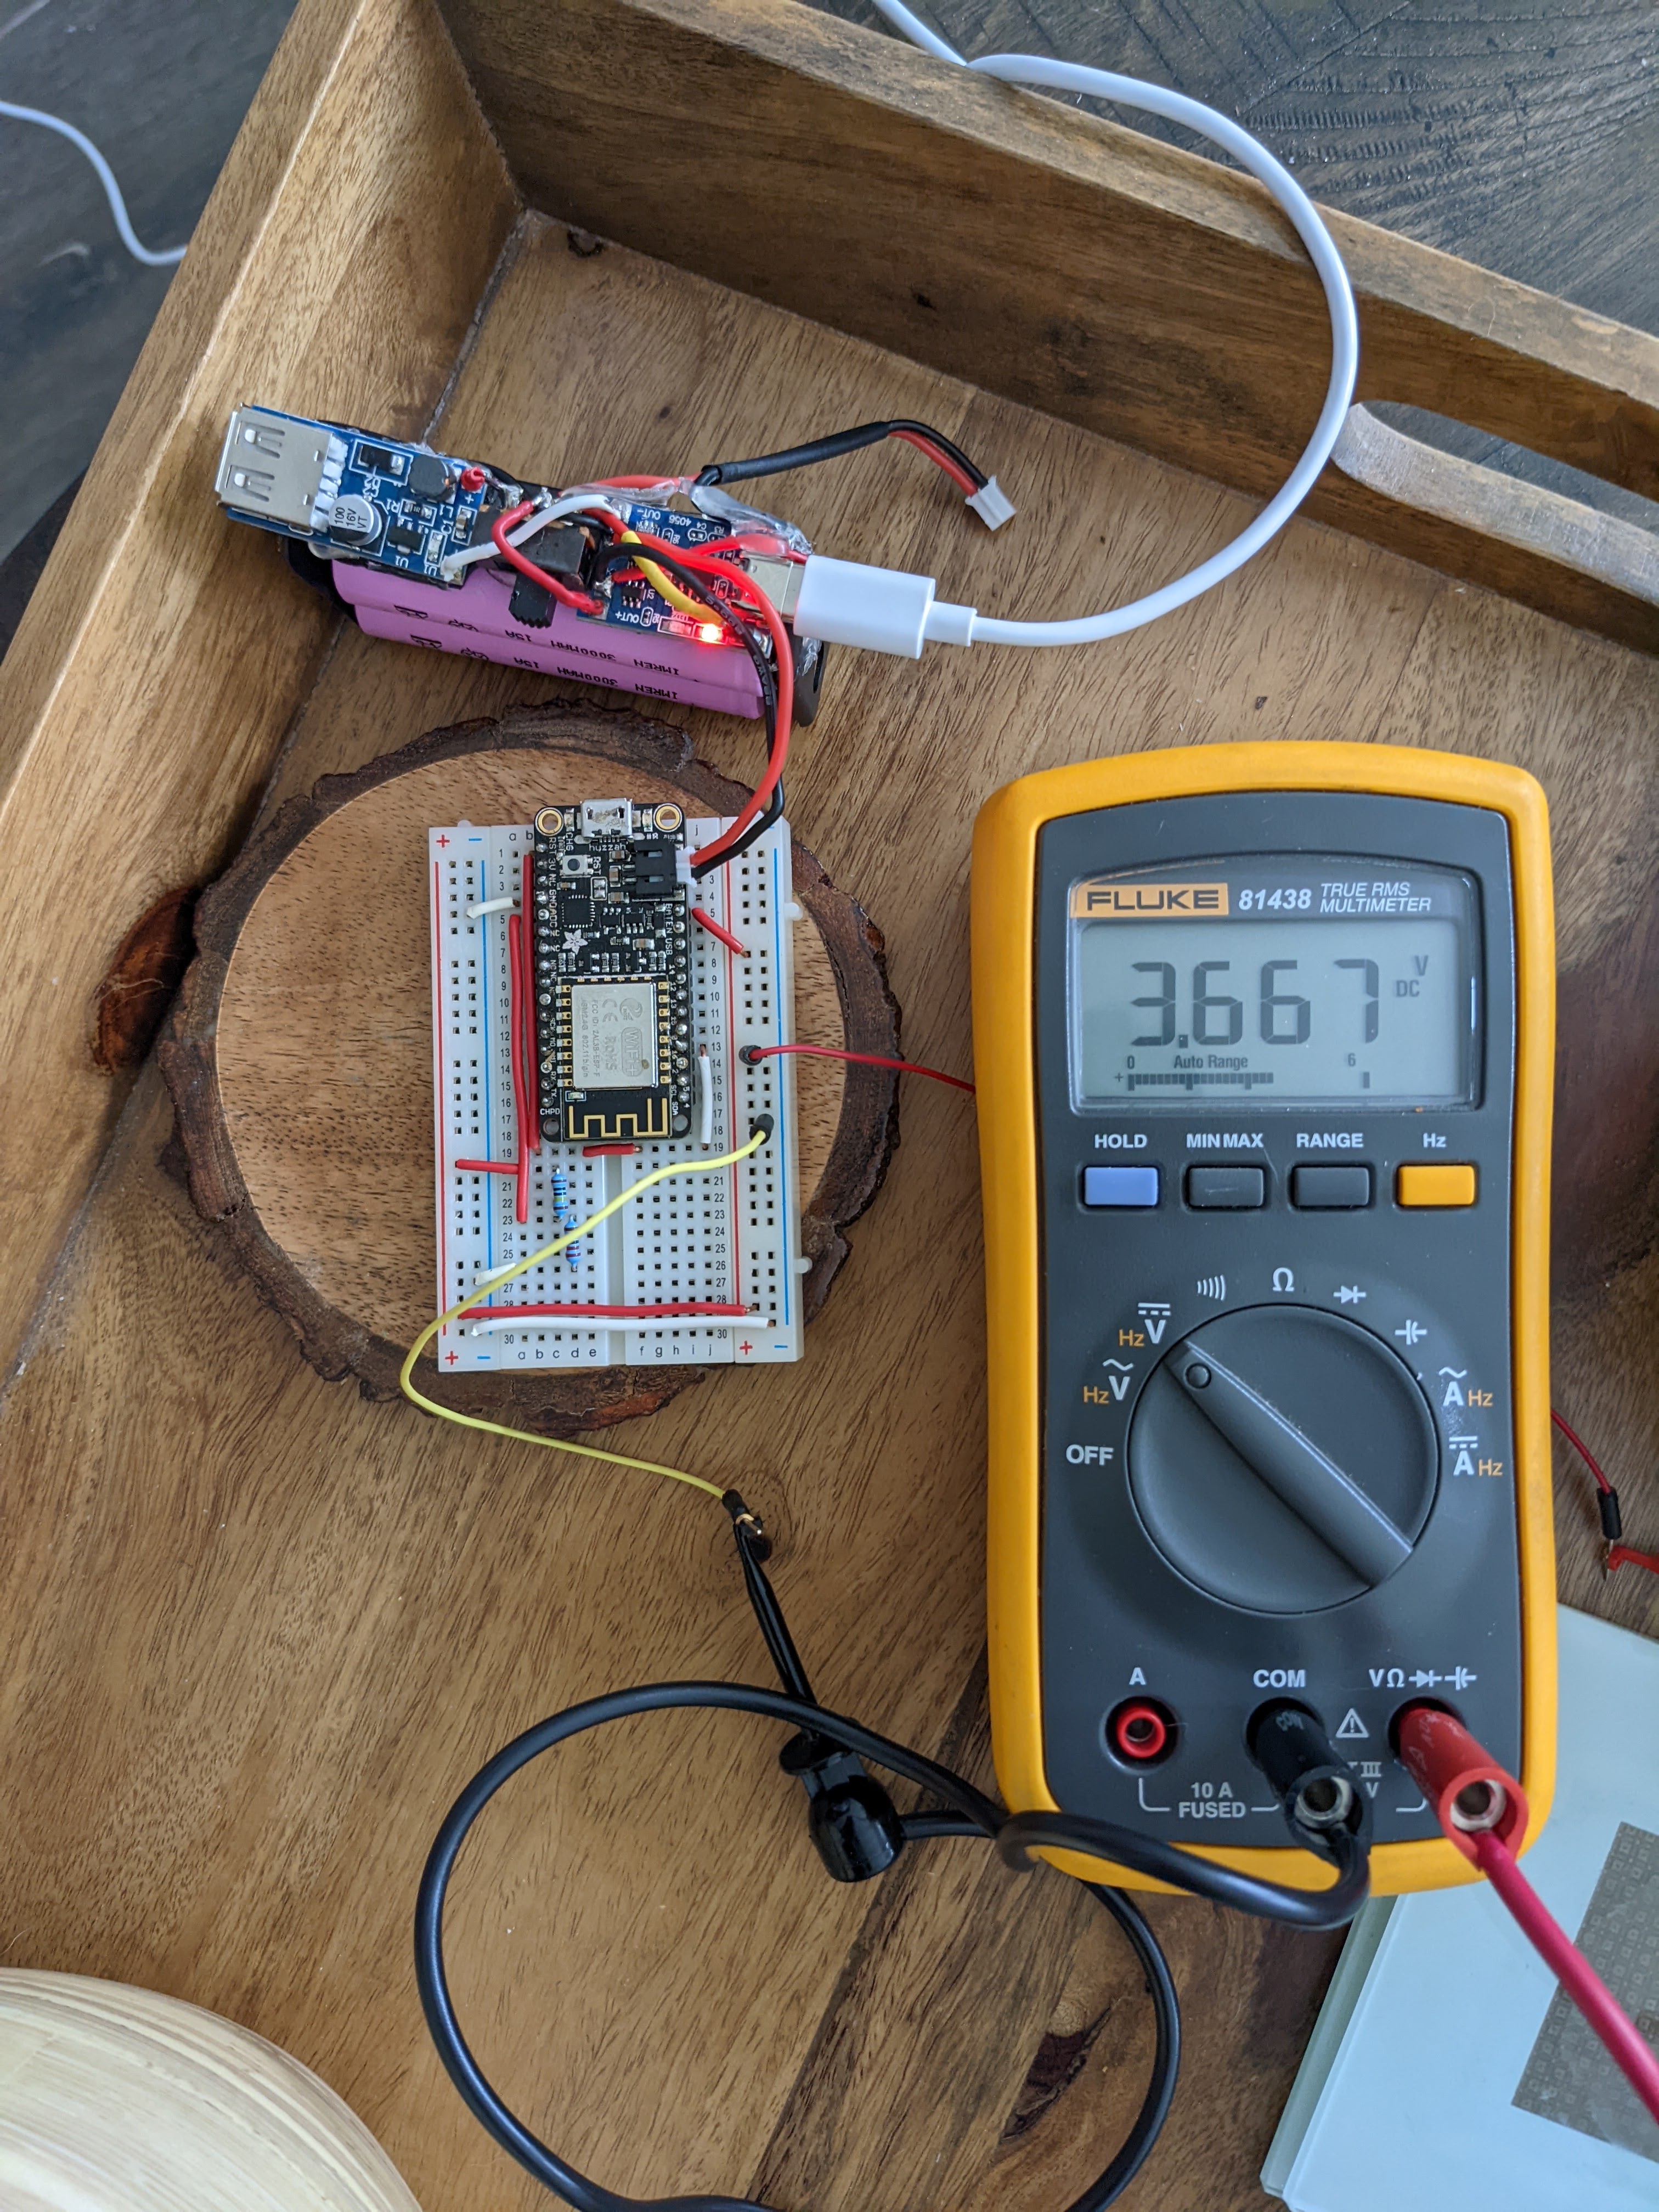
Circuit
v3 is based off of v2 except for the following.
It is being powered by a USB wall adapter instead of the solar panel.
The Feather is being powered by the li-ion battery as well and reporting the battery levels.
Add a voltage divider with R1=1MΩ and R2=220kΩ and connect it to the positive side of the charging li-ion battery and the connection point of the resistors to ADC on the Feather.
Connect the outer side of R2 to the common ground.
Connect the RST pin to pin 16.
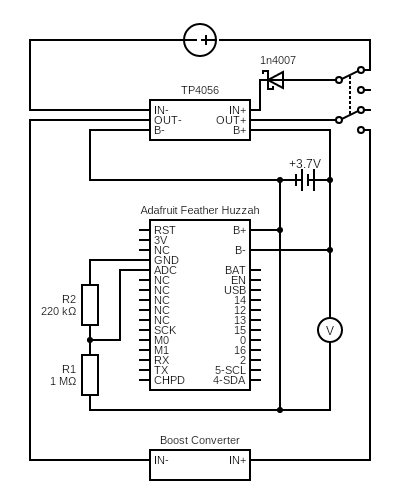
Circuit made with Circuit Diagram
Code
Change the variables in the secrets.h file and the variables at the top of the v3.ino sketch.
Compile and upload the sketch as normal.
Output
Battery level: 82%
Attempting to connect to SSID: MySSID
...
   Connected.
Channel update successful.
Battery level: 82%
Channel update successful.
Battery level: 82%
Channel update successful.
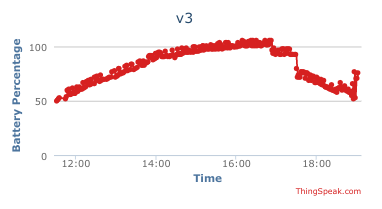
Analysis
The values go above 100% which means that the maximum voltage of the charging battery is set too low in the sketch. This might be because the Feather is also using some power while charging.
The TP4056 blue light never turned on which means the voltage never got high enough. This contradicts the maximum voltage of being over 100% so something is not right.
The values spike up and down quite a bit at the end of the graph (~19:00). This is due to the Chromebook being used at the same time as the charging. The Chromebook gave a low power charger connected notification and automatically turned on and off the charging.

The data is not very smooth. Perhaps averaging the read values a bit more would smooth out the data.
Conclusion
The large fluctuations at the end of the data (~19:00) is caused by the Chromebook fluctuating its charging load automatically.
The cut off voltage was never reached to turn on the TP4056 blue LED because the Feather was also using power from the charger.
The data should be smoothed out a bit more using some other method.
References
WIP